
I love me a 2×2.


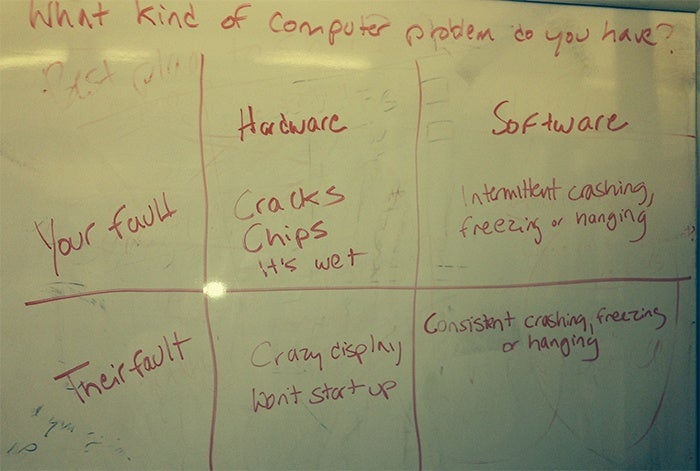
A 2×2 matrix is a great way of mapping just about any idea, research topic, or set of observations on two dimensions. For example, here’s a 2×2 mapping out the source of computer problems, which I scrawled on a whiteboard. On one axis you’ve got the type of problem: hardware or software. On the other, you’ve got the source of the problem: you (the user) or them (the manufacturer/software developer). By looking at the symptoms in each quadrant, you can figure out whether you’ve got a hardware or software problem, and whether it’s your fault or theirs.
I have used 2×2 matrices to categorize family movie choices, bumper stickers and ice cream flavors. I’ve even used them to address key themes in my professional work, like the options for data-driven storytelling and the structure of the collaborative economy. 2x2s are useful because they provide a way of rapidly making sense of a complex topic.
As Collier et al. write, typologies—of which the 2×2 is one form—can help in “forming and refining concepts, drawing out underlying dimensions, creating categories for classification and measurement, and sorting cases.” Learning how to map a set of observations, a problem or a research question as a 2×2 can help us think systematically about a subject: while a 2×2 may not accurately describe a subject in all its complexity, breaking an issue down to a couple of salient dimensions can give you a place to start.
The power of the 2×2 is especially useful when it comes to wrapping your head around an emergent space, like the field of internet research. The internet itself may be forty years old, but the job of making sense of the internet is a whole lot younger, particularly in comparison with fields that have been around for decades or even centuries. The Association of Internet Researchers, which consists mainly of social scientists and humanists, held its first meetings in 1999; the Oxford Internet Institute, arguably the premiere center for research on the social, political, and economic impact of the online world, was founded in 2001.
When I entered the field of internet research myself, back in 1996, it was literally possible to read everything written about the social and political impact of the internet, and networking technology more broadly: I did just that, within the span of a few months. Twenty years later, there is now an extensive body of research into just about every aspect of online life, politics, and business, so that an entire career can be spent within a specific niche like videogaming or social media research.
That wealth of research means it’s now possible to dive deep into a topic like the impact of video games on obesity, or the dynamics of identity construction on Facebook. But because the field of Internet scholarship is now so broad and eclectic, uncovering the overall impact of the internet on society is a more complex proposition.
Trying to make sense of the different approaches to privacy in your industry? Think about which approaches focus on tech structures, and which on human decisions…and about the impact that an approach may have on both information efficiencies and interpersonal trust. Do you want to rely on technologies that limit data access so that you can prevent oversharing and promote trust…but potentially at the expense of efficiency? Or do you want to compare different approaches that rely on human decision-making, and see which policies lead to the highest levels of user or employee trust?
Unsure whether virtual reality is the coolest thing ever, or a harbinger of doom? Consider whether its impact will be chiefly determined by the technology itself, or by the way we use it…and think about the ways it may affect interpersonal trust (will it bring us closer across distances? Or erode our instinctive trust in what’s in front of our eyes?) and informational and transactional efficiencies (will the benefits of simulating face-to-face interaction across distance accelerate transactions, or lead us to lose some of the efficiencies of depersonalized, text-based communication?)
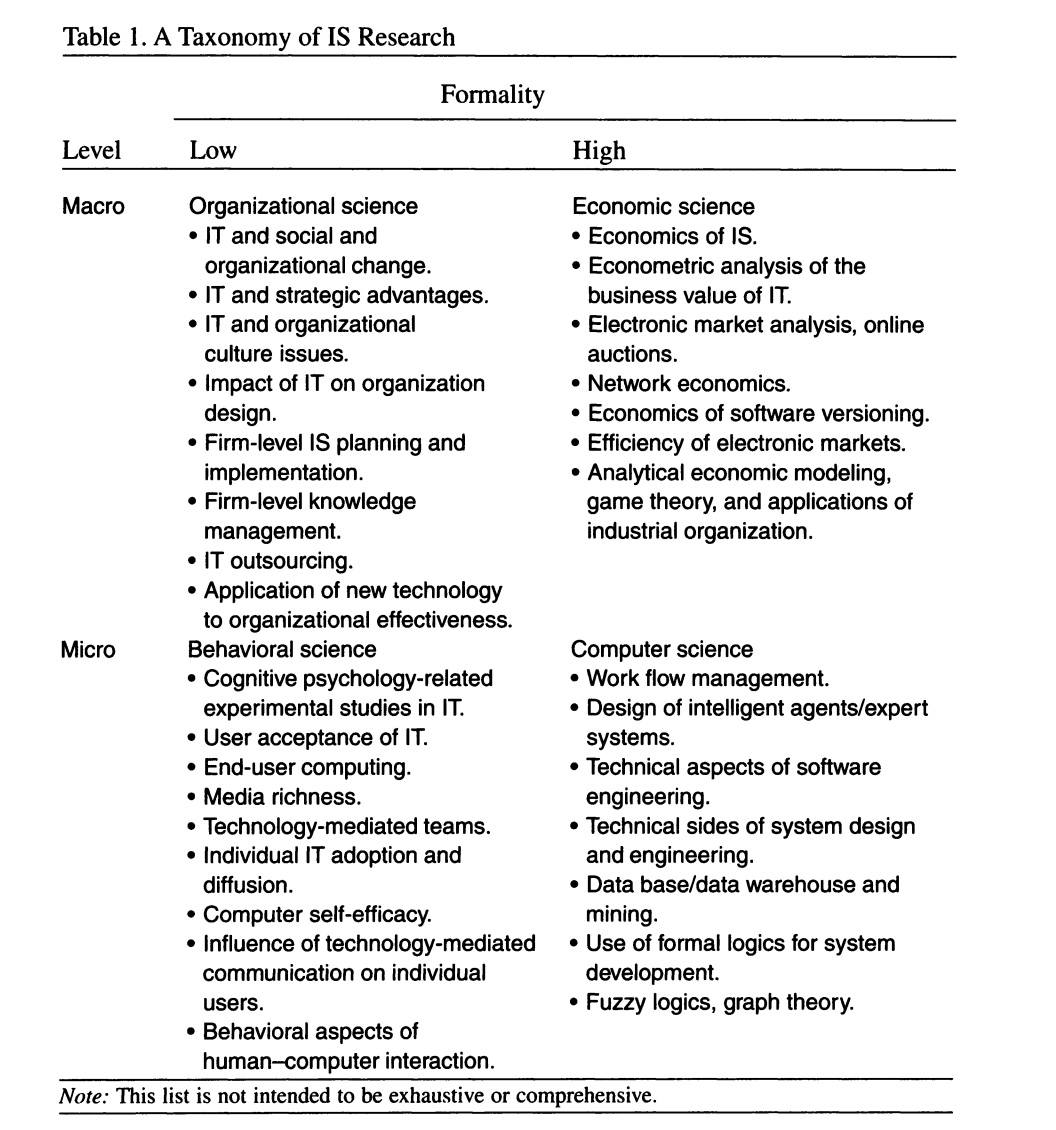
This is exactly where a 2×2 can come in handy: by helping us identify the broad dimensions of interest in a field, or by surfacing the key divisions in approach or perspective. For example, Oh et al. use a 2×2 to map information systems research as part of their investigation into cross-disciplinary collaboration within the field, which focuses on making sense of both the business and technical aspects of creating networks for the dissemination of information within or across organizations. The table maps various disciplines against “the level at which the research is carried out and the degree of formality required,” because the authors believe that “these two dimensions play dominant roles in either enabling or constraining knowledge exchange and network formation across the various subfields of IS.”
We can take the same approach to mapping the overall field of internet research in order to surface the key dilemmas, arguments and preoccupations. After looking at two dozen of the most-cited internet research articles in JSTOR’s database, I mapped the central issues and explanatory arguments that are common to a wide range of articles. (Note that I’m not mapping the technical research on subjects like networking technology: I’m focusing here on the social science, humanistic and business questions.)
Mapping the research surfaces two major dimensions:
- The key factors used to assess the impact of the internet almost always come down to some mix of technology and human factors. Some researchers focus mostly on the role that technology itself plays in our experience or outcomes; others focus on the role of human users and decisions.
- The impact researchers focus on is most often either some aspect of trust (including loyalty and social capital) or efficiency (including information efficiencies, transaction efficiencies or decision-making efficiencies).
Specific subfields of internet research tend to land in one quadrant or the other. For example, we see a lot of research around social capital, examining how specific network technologies affect interpersonal trust; and in the e-learning world, we see a lot of work on how specific human investments (for example, in training) lead to improved outcomes in terms of worker efficiency.
| Key factors | |||
|---|---|---|---|
| Technological | Human | ||
|
Impact
|
Trust | Social capital Peer support Customer loyalty
|
Social/viral marketing Privacy |
| Efficiency |
Purchase behavior |
Online contribution Online participation E-learning
|
|
Like most 2x2s, this is an oversimplification: there are many articles that consider both technological and human contributors to online experience, and there are some that address the impact on both trust and efficiencies. Some of the articles that I map in this very table take a more nuanced approach that the 2×2 suggests.
But there is a lot of value in simply identifying two dimensions that help to describe a wide range of internet research: not only does it help us make sense of a disparate, interdisciplinary field, but it provides a starting point for addressing any question about the internet’s social, political or business impact.
Mapping the world of internet research onto a 2×2 makes it a lot easier to wrap our minds around each set of questions the online world provokes. Nor should we be limited the two dimensions I’ve used here: there a lot of ways you could organize your thinking about the digital world, and each set of dimensions will surface a different set of questions and observations.
But for those of us who are sometimes overwhelmed by the complexity of the world—and not just the digital world!—the 2×2 offers a go-to strategy for organizing your ideas or getting started with any new problem. It’s not the tool for every person, or for every purpose, but it’s the best tool I know for introducing people to the power of structured analytic thinking. And I have a handy 2×2 that can help you figure out where to go next with this insight.
| Chief preoccupation | |||
|---|---|---|---|
| Analog world | Digital world | ||
|
How you feel
about 2x2s
|
Hate them |
Draw a picture of your feelings about 2x2s
|
Write a semantic analysis program that tags all internet-related research and organizes it in a relational database |
| Love them | Use a whiteboard to draw a 2×2 that maps a topic you do care about |
Send this article to everyone you know |
|