By almost every indicator, the availability of water, one of the planet’s essential resources, is shrinking. A 2017 study from The Pacific Institute reported that 1.7 billion people live in river basins where water demand outstrips supply. By 2050, that number is expected to jump to 2.3 billion. As Cape Town’s recent water shortage clearly illustrates, water security is a global risk exacerbated by climate change. If they want to be prepared to deal with floods, droughts, and inevitable leaks, utility companies and policymakers need to track water flow at both local and global levels. Scientists and engineers aim to meet this challenge by using information technology. They call it the digitization of water.


This digitization tactic, also known as “smart” water, provides real-time monitoring of water assets, enabling utilities and other authorities to make informed decisions water availability and use. “Smart water is essentially the application of database technologies within the water networks to produce actionable intelligence,” says Seth Cutler, senior industry analyst at Frost & Sullivan, a business consulting firm. “And it’s done in a way that’s much more quick and efficient, and thorough than previous solutions.”
One example of water digitization is smart water metering. “Instead of having field crews go out and periodically check meters, which is a slower, more costly and labor-intensive process, you can put data loggers in the meters that are connected to cellular networks and that can send data back to a utility or other centralized unit,” Cutler says. “You can then run all that information through software algorithms that can identify energy usage and monitor for leaks and backflow.”
David Wiberg, head of hydroinformatics at the International Water Management Institute (IWMI) says that big data is a matter of “pulling together data from all kinds of disparate sources and making it work for you in the right way.” Headquartered in Colombo, Sri Lanka, IWMI’s suite of information products and services includes mapping irrigated areas, recording drought and flood-risk patterns, plus rainwater harvesting calculations and more.
While the digitization of water measurement systems can be used in many management aspects, the special focus is on two applications: flood prediction and pipe breakage prediction.
Flood Predictions
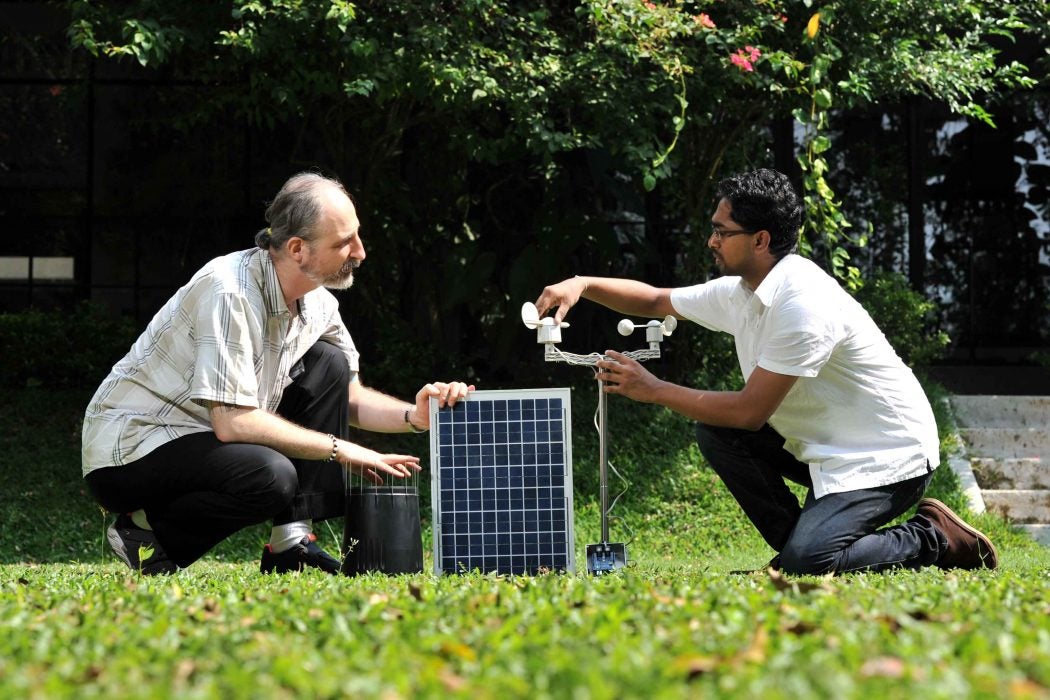
The sheer cost of installing and maintaining rain and stream can be a significant stumbling block when it comes to forecasting floods. What if there were a cheaper solution that’s also easy to monitor? This is exactly what the IWMI has done. The company encourages people involved in water management to work with IWMI’s open-source code to adjust it to their own needs rather that investing in expensive proprietary measurement instruments. This approach costs significantly less and provides real-time updates about water levels. These precipitation gauges can be set up to send text alerts— for example when more than 10 millimeters of rain per hour falls on it. This idea was prompted by the massive floods in Sri Lanka in 2013, when the irrigation department was looking for tools that could provide warning at low cost. With these alerts in place, reservoir water can be slowly released to diminish the effects of the excessive rainfall.
Having automated gauges also decreases the incidence of gaps in water readings, which happen when gauges can’t be inspected for some reason. Wiberg remembers a case in Zimbabwe where there was no data from a rain gauge for three days. It turned out that the gauge could not be inspected by a human because a lion was sleeping on it. While automatic gauges are still subject to nature’s vagaries (a mouse might chew the wires for example), they decrease the incidences of things going awry. Regular gauge inspections would remain part of the maintenance, but automation of data gathering has drastically changed water management, Wiberg says.
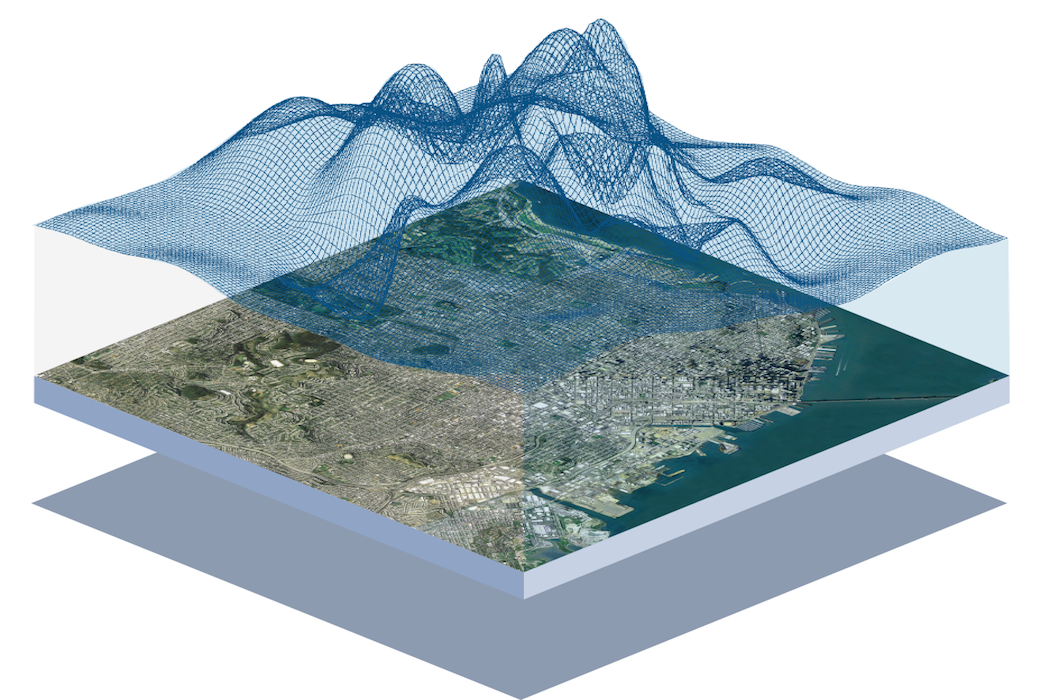
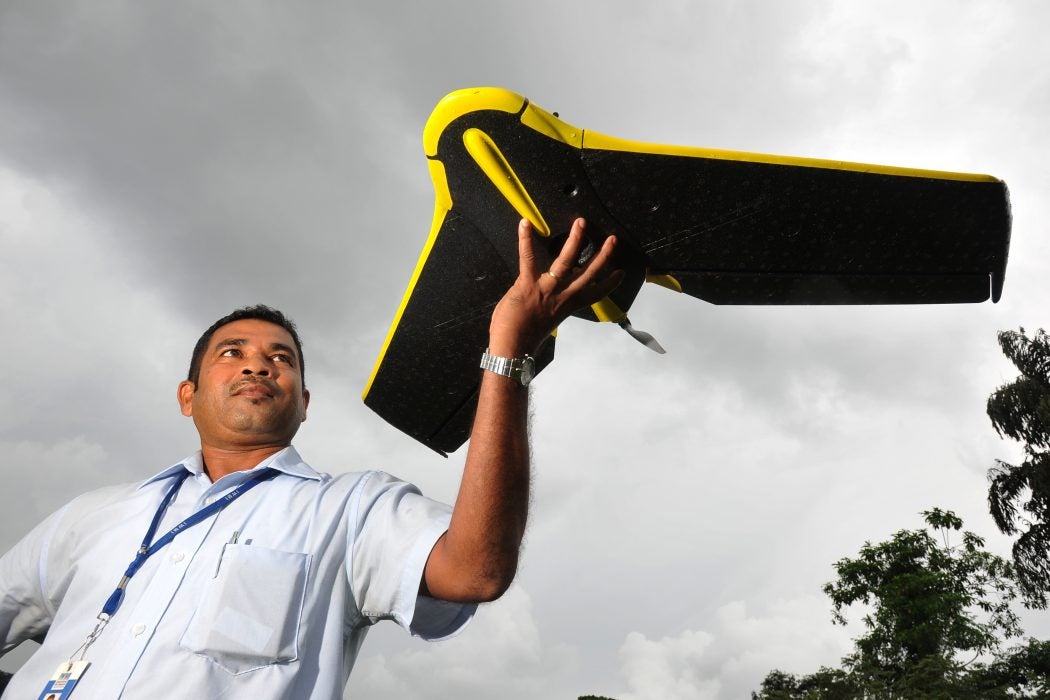
Data from automated gauge can be used with satellite sensing data to provide maps of flood-prone areas and help assess flood damage. In addition, IWMI often dispatches drones during and after floods to gather data needed for flood rescue and recovery efforts.
Other parts of the world are also digitizing their water resources. In the United States, the state of Iowa has an extensive collection of down-facing sensors on bridges, which measure the distance from the bridge to water below. Data is gathered every few minutes and when the water levels hit dangerous marks, the system sends evacuation warnings or other types of flood management information. This sensor system has decreased the incidence of floods in historically flood-prone regions. A lot of these data is also available to the public, says Steve Kopp, a member of the American Water Resources Association. The U.S. Geological Survey has a site called NWIS that maintains the information gathered from these gauges.
Of course the digitization of water resources has caused a dramatic rise in the volume of data collected and analyzed for better predictions. “We went a couple of years ago from estimating stream flow at around 4000 locations across the country to estimating stream flow at 2.7 million locations and we changed the time frequency as well,” Kopp says. As a result, the short-range water behavior forecast switched from being a daily or nightly measurement to being an hourly assessment.
How much data does digitization of water generate? Experts say it’s hard to give an accurate count because the uses are scattered, and some data is gathered together with other information. Higher resolution spatial assessments over large areas generate a lot of data, Wiberg says. For example: The fifth Intergovernmental Panel on Climate Change (IPCC) report used 29 modeling groups and 61 climate models, generating 10 petabytes of information, which equals to 10,000 terabytes. NASA’s Earth Observing System Data and Information System (EOSDIS), manages more than 22 petabytes of data and is expected to increase ten-fold by 2025. “All this information, and more, is part of and used in water resources analysis, so the numbers are huge and increasing all the time,” Wiberg says. However, information overload doesn’t always translate into good quality data. “Global, even high-resolution datasets are usually not accurate enough to use directly in practice for local assessments, but they are still used to validate, verify, and fill gaps in local information. So, we are finding uses for huge amounts of information, even if it is of varying quality,” he adds.
Predicting Pipe Breakage
There are about 240,000 water main breaks per year in the United States a year, which waste over two trillion gallons of treated drinking water. In fact, in 2017, the American Society of Civil Engineers (ASCE) gave US drinking water infrastructure a “D” rating.
At a time when city and town resources for infrastructure projects are strained, predicting where pipes are more likely to break can save money and help channel finds where they are needed most.
Fracta is a big data and machine learning company that develops models which predict where the next water pipe damage might be. A traditional “pipe heath” estimate might include soil tests, placing moisture sensors around, and factoring in the pipe’s age to make predictions.
In contrast, machine learning collects data on about 1,000 variables gathered over the years from a few existing water utility companies and extrapolates that model to other enterprises. These variables include soil type, soil pH, proximity to saltwater, slope of the street, material of the pipe, diameter, installation year, and more. Fracta’s experts Lars Stenstedt and Matti Kakkori say that their machine learning system database keeps track of about 7,800 miles of water main pipes, including information about more than 30,000 prior water main breaks. The U.S. has 1.2 million miles of water supply mains, but Fracta’s data is more than enough to make accurate predictions, Stenstedt says. The machine learning algorithm means that as more data is added, the predictions will grow more accurate. Such intelligence can be a great way for various water utilities to band together for mutual benefit, Stenstedt adds.
The Future is Digital
The digitization of water is still in early stages and many stumbling blocks remain. For one, a lot of data is stored by various governmental agencies, many of which aren’t in a hurry to forge alliances with external communities. But it’s clear that information engineering is the new paradigm for water management.
Citizen engagement can also play an important role in the process. For example, IWMI is looking to work with mobile phone companies, energy companies, schools, agri-business, builders and contractors, and insurance companies. “All of these can provide relevant biophysical and socio-economic data that can be useful for water management,” Wiberg says. Insurance companies, for example, use weather stations to keep information on risks and damages, which in turn can be used by water managers. Insurers also educate clients about better managing water, as well as risks, which saves money for both the insurers and their clients.
“There really is a drive now to better use the data we are generating and collect the right analytics so we can make better decisions,” says Will Sarni, founder of Water Foundry, a firm that provides water management solutions to global companies. “With the digitization of water you’ve really got a lot of potential to manage that gallon of water much more effectively going forward.”