In 1609, the great Renaissance scientist Galileo Galilei put a handheld telescope to his eye and looked to the heavens. In doing so, he opened the universe to direct human vision. Today, it remains a thrill to see Saturn’s majestic rings through an optical telescope, as Galileo did. Astronomers and astrophysicists continue to learn about the universe, examining galaxies, stars, and planets at the visible light wavelengths.


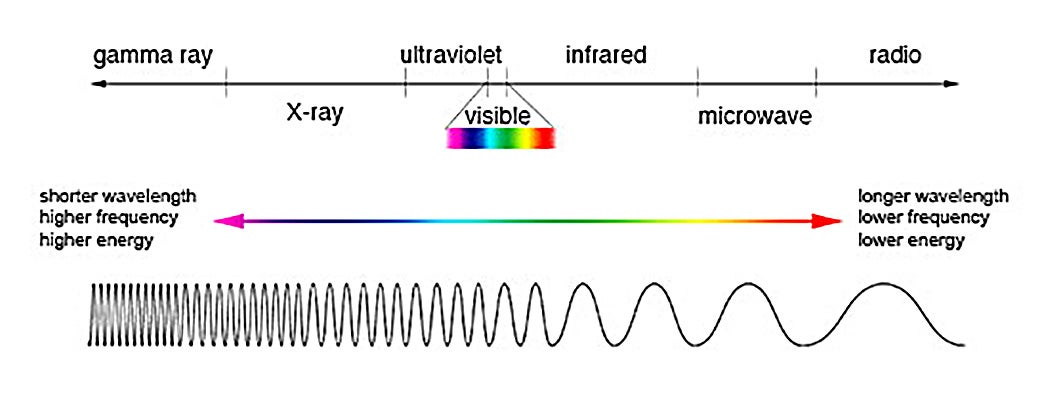
Astrophysicists also study the invisible universe: at electromagnetic wavelengths, shorter than visible light; in the gamma ray and ultraviolet regions; and at even longer wavelengths, in the infrared. Each range gives new information. But it was a surprise when we found how much more information there is at still-longer wavelengths, millimeters to centimeters. We generate such waves within microwave ovens and automotive cruise control systems. These waves also occur naturally in space, where they carry clues about the birth and growth of the universe, the centers of black holes, and the origins of life itself.
* * *
It’s a truism in science that important discoveries often arose from serendipitous events. The German physicist Wilhelm Roentgen discovered X-rays after he saw an unexpected glow from a fluorescent screen in his lab. The French physicist Henri Becquerel discovered radioactivity when he noticed that photographic film stored in a drawer had become unaccountably fogged. Roentgen and Becquerel won Nobel prizes in physics for their discoveries. These researchers displayed the observational skills and the curiosity that lie at the heart of science, bringing us to a deeper understanding of nature.
Likewise, observations of the invisible universe, detectable in long wavelength photons in space were first found by accident, in 1964. In a project to develop orbiting communications satellites, researchers Arno Penzias and Robert Wilson, at Bell Telephone’s New Jersey laboratories, used a ground-based antenna pointed at the sky. Unexpectedly, it picked up a signal of unknown origin at a wavelength of 7.35 cm, which remained constant no matter where in the skies the antenna pointed.
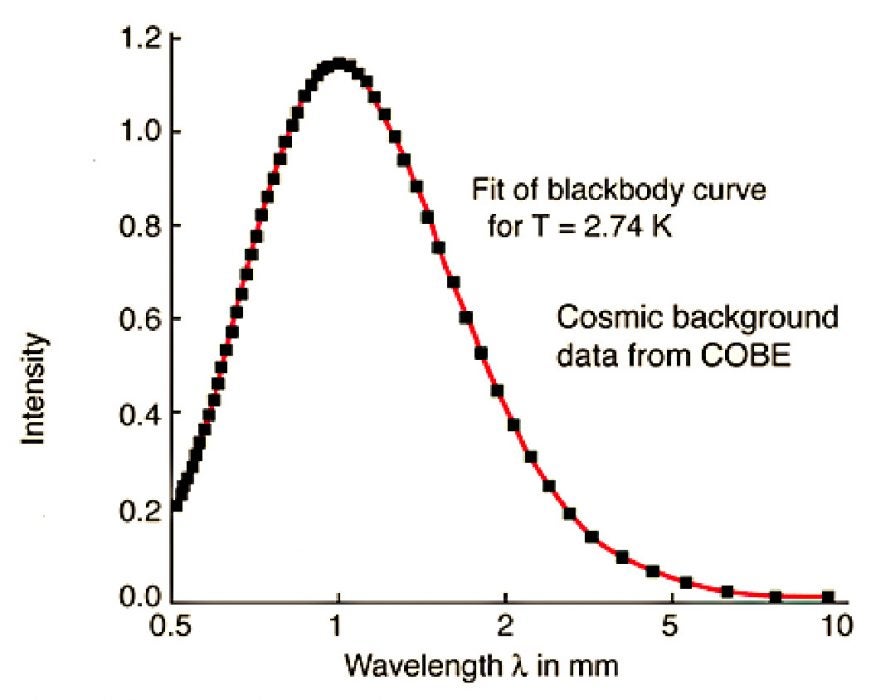
To study this radiation without interference from the Earth’s atmosphere, in 1989, NASA launched the Cosmic Background Explorer (COBE) satellite into space, equipped with instruments to measure the strength and wavelength of millimeter and centimeter waves. The results, published in 1993, showed a distinctive peak at 1.07 mm, a “blackbody curve,” which describes the electromagnetic waves emitted by any object above absolute zero temperature. The peak intensity and wavelength depend on the object’s temperature. Our sun, a hot body at 5,800 degrees kelvin (K), emits visible light with a peak at 500 nm. The COBE data perfectly followed the same theory, but calculated for the extremely low temperature of 2.725K, which generates millimeter and centimeter waves.
The COBE measurement of the so-called Cosmic Microwave Background (CMB), along with the fact that the universe is expanding, provides strong evidence for the Big Bang. According to the theory, the universe began 13.8 billion years ago at an unimaginable density and a temperature of billions of degrees. The Big Bang produced highly energetic short wavelength photons that survive today as relics of cosmic birth, although they have changed: as the universe cooled and expanded, the photons carried lower energies at longer wavelengths. Today, they fill a universe whose temperature is near absolute zero. The clincher is that the measured value, 2.725K, agrees with the theoretical prediction of 3K based on the Big Bang—a prediction made in 1965, shortly after Penzias and Wilson made their accidental discovery.
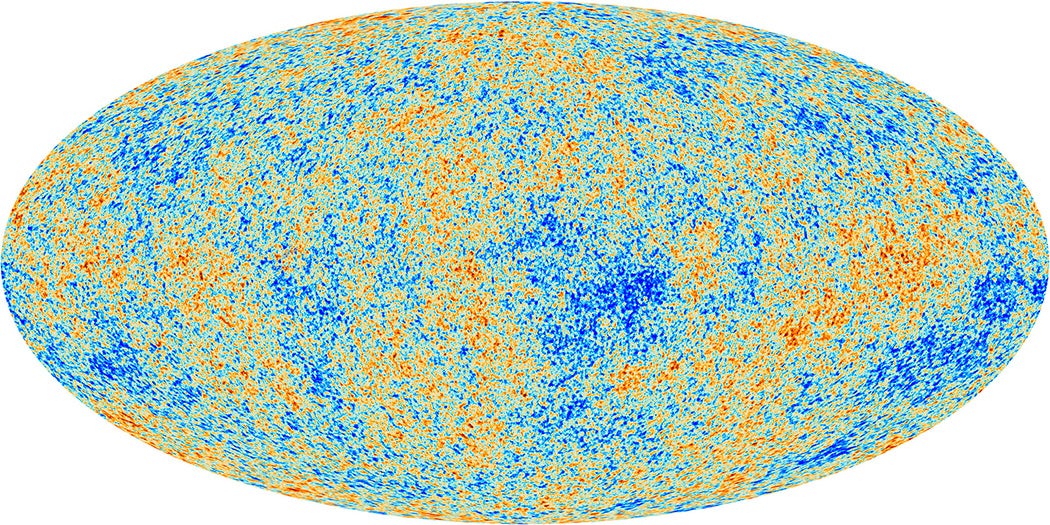
The COBE results showed something else that ground-based data had not: that the CMB—and therefore the temperature—was not perfectly even, but varied slightly across the sky. This was important news about the state of the universe at the time when photons began traveling through it, 400,000 years after its birth. The temperature fluctuations track changes in the density of the hydrogen that then filled the universe. These density variations are the seeds that grew into today’s cosmic macrostructure, consisting of strings of galaxies surrounding huge empty voids.
Mapping the Big Bang
To closely examine the density variations, in 2009, the European Space Agency (ESA) launched its Planck spacecraft, named after Max Planck, who derived blackbody theory in 1900. With improved technology (compared to COBE), the Planck spacecraft scanned the skies at nine wavelengths between 0.35 mm and 1 cm, measuring temperature differences down to 1 microK. After the spacecraft gathered the data, ESA scientists turned it into a high-resolution map of temperatures in the early universe as they appear in the CMB.
Scientists analyzed that map with the Big Bang theory and general relativity, Einstein’s theory of gravitation, in mind. The goal was to see how the density variation produced a universe that contains all of the following:
• ordinary matter, the kind that surrounds us on Earth;
• dark matter, which exists in space and has gravitational effects but cannot be seen;
• and dark energy, which seems to fill all space and acts to expand the universe against gravity.
The final results, announced in 2018, give the most precise and complete description of the universe to date. We now know that it is approximately 13.8 billion years old, and is made of 4.9% normal matter, 26.6% dark matter, and 68.5% dark energy. To underline the point: 95.1% of the cosmos consists of entities unlike anything on Earth, whose nature we do not fully understand—we can only speculate until we learn more.
The analysis of the Planck data provided another surprise in the value it gave for a particular number, the Hubble constant, H₀. In 1929, the American astronomer Edwin Hubble, observing galaxies through what was then the world’s biggest optical telescope, at Mt. Wilson, California, confirmed earlier ideas that the universe is expanding. Hubble derived a value for H₀, which gives the rate of expansion at different distances from the Earth or any other specific spot in space. H₀ has since been recalculated from newer astronomical data, but the value from the Planck data was 8% smaller than the recalculated value, indicating a slower expansion rate in the young universe. That discrepancy is now under intensive scrutiny, although we may have to wait until a planned new space mission, to take place in the mid 2020s, to learn if it is due to an error or represents new knowledge.
Taking a Picture of a Black Hole
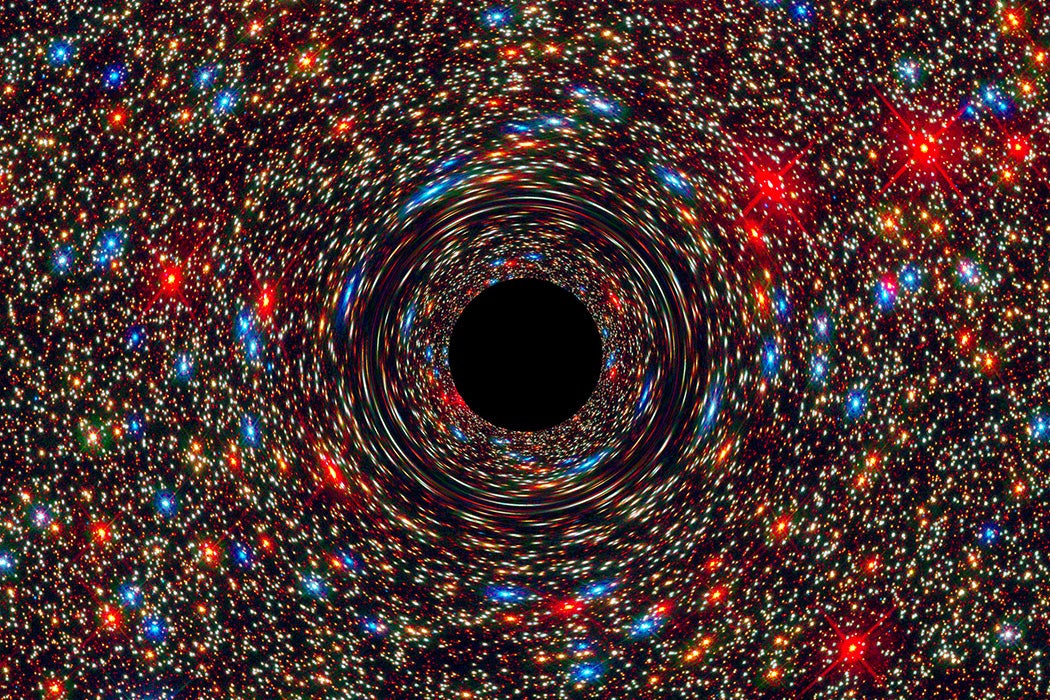
Observations at millimeter wavelengths also made possible the first image of the most exotic cosmic object we know, a black hole. These regions, where incredibly dense matter produces a gravitational field so strong that not even light can escape, were predicted from general relativity. Since then, they have been observed in our own galaxy and elsewhere—not directly, but by means of gas molecules and dust particles pulled in by the powerful gravity. These components collide and generate tremendous heat, x-rays, and gamma rays, creating a glowing accretion disk around the hole.
In 2009, the Event Horizon Telescope (EHT) research consortium set out to image a black hole at the center of a distant galaxy denoted as M87. The event horizon is the imaginary surface around a black hole that represents the “point of no return;” once past it, no incoming object or photon can leave. But measurements had shown that photons of about 1 millimeter wavelength could escape the intense gravity just outside the event horizon and emerge through the accretion disk. EHT planned to detect these photons and turn them into a picture.
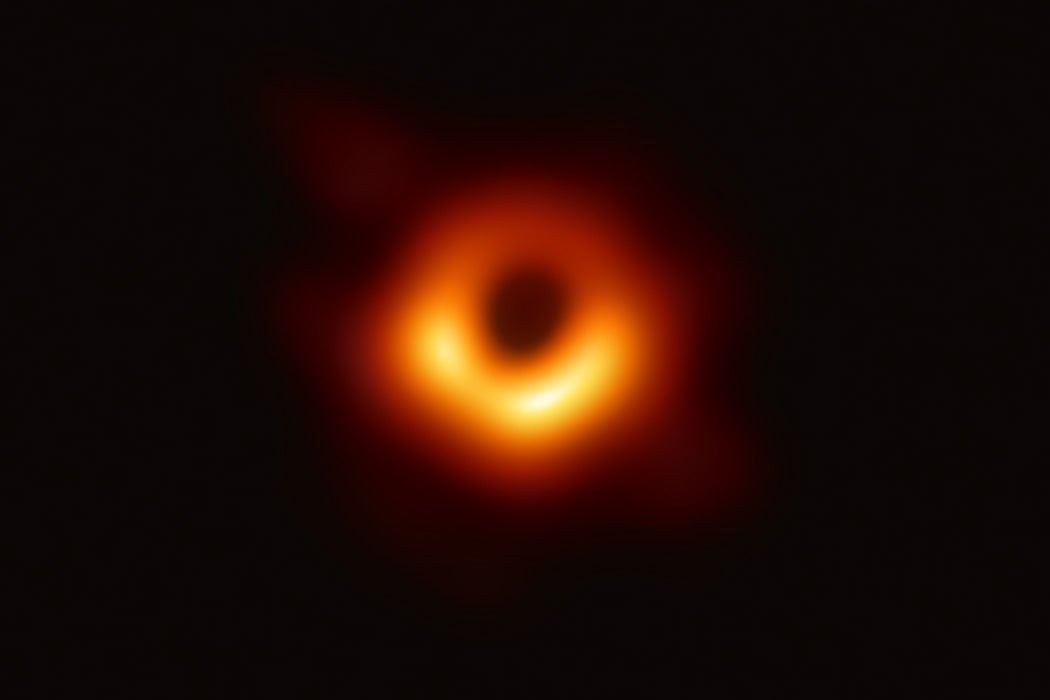
This was a tall order, one that required an array of ground-based radio telescope dishes to form an image. At a distance of 55 million light years, the target area within M87 appears as a tiny dot, about the size of a U.S. quarter viewed from 100,000 kilometers away. To obtain an acceptable image, the researchers had to minimize diffraction, where electromagnetic waves are distorted as they enter an aperture, like the bowl of a radio telescope. The bigger the aperture, the less the diffraction. EHT managed the diffraction with a clever scheme that coordinated observations from eight different radio telescope installations around the world. This created an Earth-sized virtual telescope with extremely high resolution.
After recording and analyzing data measured at a wavelength of 1.3 mm, in April 2019, EHT presented its image. The by-now-familiar picture clearly shows a dark “shadow” inside the glowing accretion disk at the center of M87. The shadow closely surrounds the black hole’s event horizon, making this the nearest we have come to pinpointing a black hole itself. The data shows that the mass within the black hole is 6.5×10⁹ times that of our Sun. This supports what has been long surmised, that “supermassive” black holes lie at the center of galaxies, where they produce accretion disks called quasars, the brightest known astronomical objects.
Weekly Newsletter
"*" indicates required fields
Imaging the Beginnings of Life
Finally, perhaps the most intriguing use of long-wavelength radio astronomy seeks the beginnings of life in an inanimate universe. One theory for these origins is that the necessary complex molecules, such as the amino acids that form proteins, were created by chemical processes in space. These molecules then seeded life by coming to Earth and perhaps other planets. Judging by life on Earth, the needed compounds are invariably organic molecules, containing carbon, hydrogen, oxygen, and nitrogen. Organic molecules and amino acids have been found in meteorites that reached Earth, which inspires the search for them in space.
A molecule in space is identified by finding features at characteristic “fingerprint” wavelengths in the radiation the molecule emits or absorbs. The organic molecules important for life processes are relatively massive, with ten or more atoms, and typically produce fingerprint features at millimeter to centimeter wavelengths. Radio telescopes operating in this range have found many organic molecules among the more than 200 types discovered in our galaxy and elsewhere, containing up to 13 atoms. A measurement in 2003 reportedly detected an amino acid, but that has not been replicated since. However, “precursor” molecules have been found: molecules that could change into sugars or amino acids with just a few chemical steps.
One telescope system that was used in EHT is also highly effective in seeking organic molecules. In the Atacama Large Millimeter/submillimeter Array (ALMA), 66 dishes working together form the world’s biggest single radio telescope installation.
I visited the Atacama Desert, in Chile, years ago and remember a bleak environment—hardly an advertisement for the lushness of Earthly life. But Atacama’s altitude and dryness are ideal for the ground-based spectroscopic search for the molecules of life. In 2014, researchers using ALMA at 3 mm wavelength found isopropyl cyanide, the first organic molecule discovered in space with carbon atoms arranged like those in the amino acids contained in meteorites. It occurred within a giant cloud of gas and dust in our own galaxy, where new stars form. As the quest for complex, biologically significant molecules continues, researchers should point their telescopes to regions in space where stars and planets are in the process of being born.